


Here is the most current, accurate data on opioid-related overdoses.
The opioid crisis has had a significant impact in the United States, with more than 1 million people having died from drug overdoses since 1999, and a substantial majority of these deaths involving opioids. In 2021 alone, over 80,000 deaths were attributed to opioid overdoses, with nearly 88% of these involving synthetic opioids such as fentanyl.
These resources provide a historical overview of the opioid crisis, highlighting the rise in overdose deaths, changes in the types of opioids involved, and the demographics of the affected populations. For more detailed and specific historical data, charts, and graphs from 2000 to 2022, these sources and the CDC’s website would be valuable resources to explore.
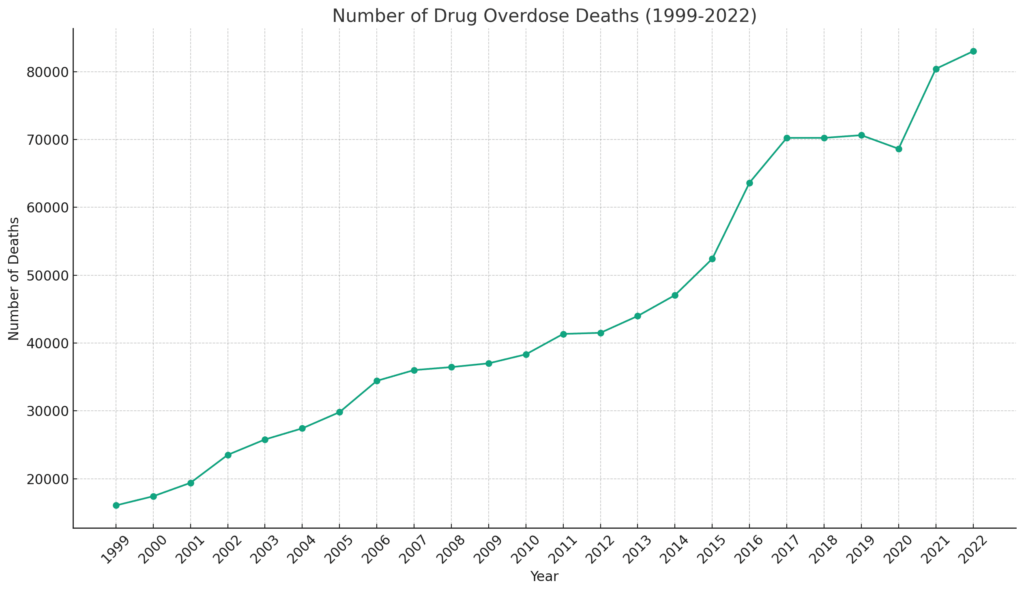
Overdose Deaths Timeline From 1999 to 2022
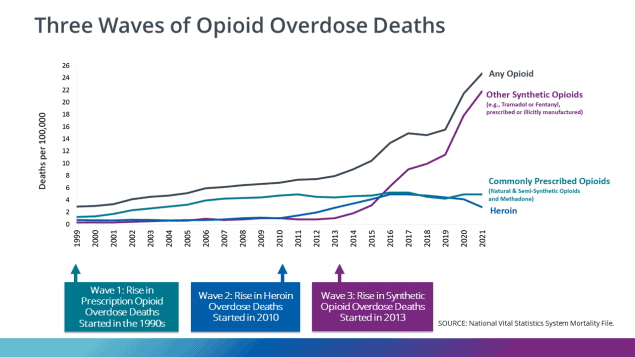
Three Waves of Opioid Overdose Deaths
The opioid overdose crisis in the United States, which saw nearly 645,000 fatalities from 1999 to 2021, is often characterized by three distinct phases:
Each wave of the opioid crisis has its unique characteristics and challenges, reflecting changes in drug availability, user behavior, and the evolving nature of the illicit drug market. These waves cumulatively have led to a dramatic increase in opioid-related fatalities and continue to pose a significant public health challenge.
Opioid Overdose Death Rates – By Type
The graph illustrates the trends in overdose death rates involving opioids in the United States from 1999 through 2020, segmented by the type of opioid. The graph shows four distinct lines representing different categories of opioids: commonly prescribed opioids (including natural & semi-synthetic opioids and methadone), heroin, other synthetic opioids (such as fentanyl and tramadol), and a cumulative line for any opioids.
From the graph, it is evident that the death rate from commonly prescribed opioids began to rise slowly from 1999, but showed a more noticeable increase around 2006, peaking between 2010 and 2012 before stabilizing and slightly declining. Heroin-related deaths remained relatively stable until about 2010, after which there was a sharp increase, indicating the second wave of the opioid crisis. The death rate for heroin peaked around 2016 and then plateaued.

The most alarming trend in the graph is the sharp and consistent rise in deaths involving other synthetic opioids starting around 2013, which marks the onset of the third wave of the opioid crisis. This line shows a drastic increase and by 2020, has reached a death rate significantly higher than any other category, underscoring the severe impact of synthetic opioids like fentanyl on the opioid overdose crisis. This category’s steep rise highlights the urgency of addressing the proliferation and use of these potent substances.
Opioid-related Overdose Deaths by Gender
Below is a chart depicting the opioid-related death rates in the United States from 1999 to 2021, broken down by gender. The blue bars represent the total number of deaths each year, while the orange and yellow lines depict the number of deaths for males and females, respectively. From the outset, the total number of opioid-related deaths shows a worrying upward trajectory, beginning with a relatively low number in 1999 and culminating in a steep rise to over 80,000 deaths in 2021.
A closer look at the gender-specific lines indicates that males have consistently experienced higher opioid-related death rates compared to females throughout the entire time span. The male death rate (orange line) shows a more pronounced increase, particularly from 2010 onwards, which aligns with the burgeoning opioid crisis fueled by the widespread availability of highly potent synthetic opioids like fentanyl. In 2021, the death rate among males spiked dramatically, far outpacing the rate for females.
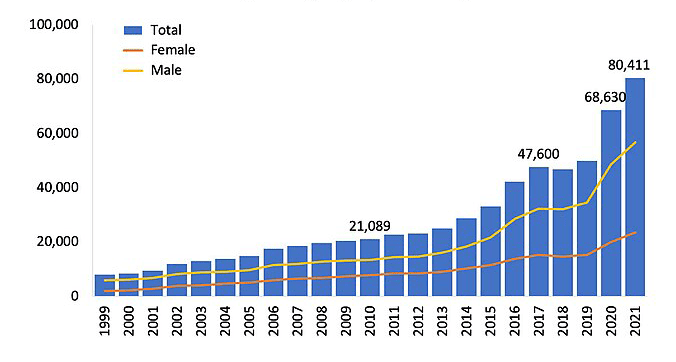
The female death rate (yellow line), while lower than that of males, also reveals an increase over the same period, but with a less steep incline. This suggests that while the opioid crisis has affected both genders, males have been disproportionately impacted. Despite the difference in magnitude, the trend lines for both genders follow a similar pattern, reflecting the overall escalation of the opioid crisis. The graph underscores the critical public health issue of opioid overdoses and the importance of gender-specific considerations in addressing the crisis.
